Neurogliaform cell type
Using genetic fate-mapping in combination with single-cell transcriptomics, we isolated and sequenced upper-layers (ULs) cortical NGCs. By aligning their transcriptomes to a reference atlas (Tasic et al., 2018), we revealed that ULs NGCs are molecularly different compared to other Htr3a-expressing interneurons (Non-NGCs).
Notably, these two cell type families express a combinatorial code of transcription factors (TFs). Specifically, while NGCs show an enriched expression of the TOX family of TFs (Tox2, Tox3), non-NGCs specifically express the NPAS family (Npas2, Npas3).
Select Gene:
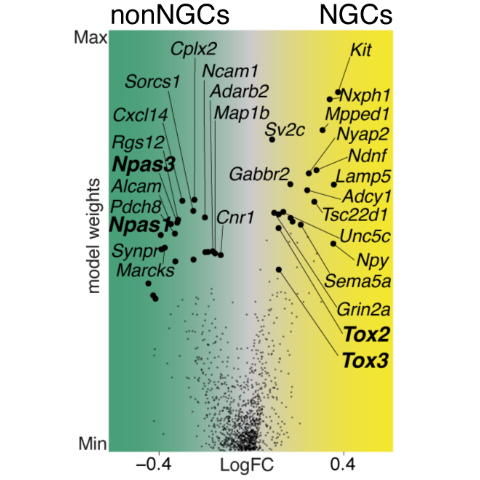
DEGs Volcano plot
Cell type gene architectures.
Expression fold-change (x-axis) vs. celltype model weights (y-axis).
Postnatal landscape (Tox2)
Maturation model weights (x-axis) vs. celltype model weights (y-axis).
Postnatal waves (Tox2)
Gene smoothed expression across time.
Maturation model weights (x-axis) vs. logRPM RNA (y-axis).